
In connection with the recent launch of a high-profile Drupal-based website, one of my responsibilities was to evaluate how well the then un-launched system would perform under the expected load. As a web developer, I don't often have the opportunity to do load testing, so I had to do some research on the topic beforehand. This post is a summary of the steps I took and my findings.
The site had been in operation for quite some time, so we had existing statistics that helped us predict how many visitors the site would need to be able to serve. Using JMeter, I tried to replicate the load the server was likely to undergo.
Setting up JMeter
JMeter is a powerful open-source Java application with a wide variety of features, which makes it daunting to set up a test plan in it. While I was browsing for documentation on the topic, I found a sample JMeter plan specific for Drupal on Drupal Performance Testing Suite’s page. This plan comes with HTTP request, header, and listener elements set up. The following figure shows how the plan document looks.
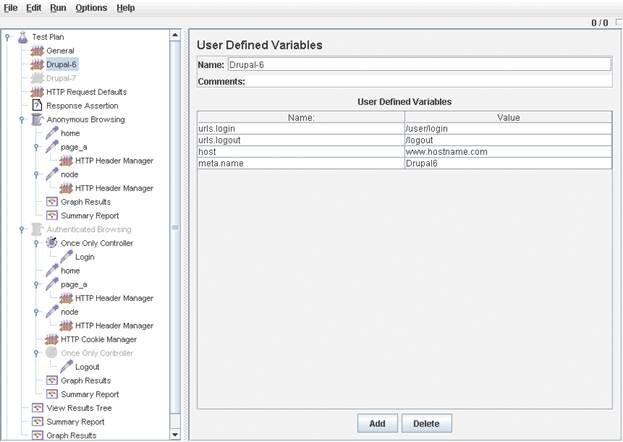
The following are the few customizations one needs to do before using it:
- Activate the User Defined Variable element corresponding to your Drupal version; deactivate the other.
- Set host variable to the hostname of the server you wish to test.
- In both thread groups, set the Number of Threads. This is the number concurrent users you wish to simulate.
- In both thread groups, set the Loop Count. This number will determine how many times each thread is run, and therefore controls the length of the test. If you wish to get a picture of how the server performs under constant load, aim for minute-long tests. Second-long tests may not yield relevant results, because the server may need some time to stabilize under the changed load conditions – new server threads need to be created, for example. If you have a target time, and an approximate value for the throughput (the number of requests the server can handle in one second), you can calculate the Loop Count with this formula:
Loop Count = Throughput * Time / Number of Threads.
- Modify, add or delete HTTP request elements so that they reflect the pages that you wish to fetch with the request.
- Keep-alive and Accept-Encoding headers may be adjusted in HTTP Header Manager elements, although it is typical to find keep-alive and compression enabled in most browsers, so leaving them intact should be fine.
After experimenting with it on Windows, I found that JMeter uses up a lot of memory, and will throw a java.lang.OutOfMemoryError: GC overhead limit exceeded error eventually. The problem can be mitigated by setting the memory limits in jmeter.bat. With the limit set to 512MB, it was able to run about 3100 requests. Although I did not go above this number, I still increased the memory limit so that it does not impact speed as it gets close to this number and fills up the memory.
Preparing Data
In order to get an idea of how many concurrent users I should simulate, I examined the site statistics. The owner of the websites oranizes events, which tends to attract more visitors to the website than usual. For that reason, there are occasional spikes in server load, which is illustrated by the figure below.
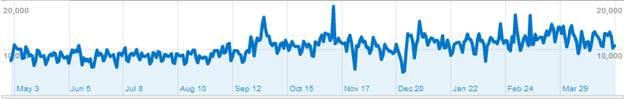
Visitors between 5/1/2010 and 5/1/2011. Total visitors: 3,835,880
To get a sense of how the server handles increasing traffic, I wanted to run multiple tests with gradually increasing number of concurrent users. I chose the smallest number to start the test with to be the average number of concurrent visitors based on one month’s data. Of course this does not tell us much about the actual load at any given moment, but it gives a stress baseline that the sever is constantly subject to. The following figure shows the data that was used to calculate the average number of concurrent visitors.
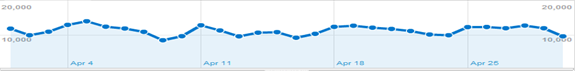
Visitors between 4/1/2011 and 4/30/2011
Total visitors: 366,975
Total pageviews: 937,643
Avg. time on site: 87 sec
The data that are readily available to us in Google Analytics are the number of visitors and the average length of visit. From those numbers, one can calculate the number of concurrent users using the following formula:
Number of Concurrent Users = Rate of Incoming Visitors * Time of Visit
Because we have the length of visit in seconds, we also need to project the number of monthly visitors to seconds.
Rate of Incoming Visitors = 366,975 visitor / (30 days * 24 hours * 60 minutes * 60 seconds) = 0.1415 visitors / second
which gives
Number of Concurrent Users = (0.1415 visitor / second) * 87 seconds = 13 visitors
The second cycle of tests was based on the data corresponding to a recent peak. That showed traffic that the server would definitely encounter in the future. I chose the peak of 3/11, which is the largest peak in this year’s data. The figure below shows the hourly graph for visitors on 3/11.
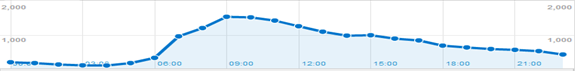
Hourly graph for the peak of 3/11/2011.
Visitors at the peak of 9am: 1,570
Pageviews at the peak of 9am: 5,328
Avg. time on site: 108 sec
The number of visitors at the peak of 9am is 1570. Applying the previously used formula, we get
Rate of Incoming Visitors = 1,570 visitors / 60 minutes / 60 seconds = 0.4361 visitors / second
Number of Concurrent Users = (0. 4361 visitor / second) * 108 seconds = 48 visitors
Finally, in the third cycle of tests, I wanted to stay on the safe side, and come up with a number that surpasses any anticipated surge. It seemed reasonable to think that a load about twice as much as the largest peak so far would be an extreme event and unlikely during normal operation (or there would be some warning signs at least). Therefore I set the visitor parameter to 100 in the last round of tests.
That gave me 13, 48, and 100 in terms of concurrent visitors to test. Next I had to decide which pages I should run the tests against. Whatever I choose would have been unrealistic, because it is pretty unlikely that hundreds of visitors click through the same couple of pages. The best I thought I could do is run the tests against the pages that are visited the most frequently. That way, the test requests overlap a large portion of the real-life requests.
The most visited page on the site I am testing is the homepage, which contains multiple Drupal Views. There is another page that has many inbound links and is requested more often than all the other pages; I included that too. The third page I tested is a Drupal node page. Node pages are very similar in structure, and make up the vast majority of pages. I will refer to these pages as Homepage, Landing Page, and Node, respectively.
Running the Tests
The load was generated on a separate computer in a network separate from the server. That way, the test results include every factor that comes into play when someone requests a page, including network latencies as well as page rendering times. Furthermore, if the load had been generated on the same machine that serves the pages, the load generator would have taken away some of the server’s resources, thus affecting the results.
During the tests, I monitored the server load, using the top command. I noted 1-minute average values read toward the end of the test. Because all the tests ran longer than 1 minute, all the data in the average are covered by the test load. The test results were acquired from the Summary Report element of the test plan. I ran the tests multiple times and took the results that I was able to reproduce.
Drupal page caching is enabled on the site. There is no open registration available; only employees of the organization have user accounts; the majority of the traffic comes from anonymous users.
The test results are as follows:
13 concurrent visitors, 100 loops
Load: 0.56
| Samples | Avg. response time (ms) | Min. response time (ms) | Max. response time (ms) | Std dev | Error % | Throughput (pages/sec) | Throughput (kb/sec) | Avg. transferred bytes | |
|---|---|---|---|---|---|---|---|---|---|
| Homepage | 1300 | 489 | 435 | 789 | 16.55 | 0 | 16.15 | 874.60 | 55442 |
| Landing Page | 1300 | 149 | 140 | 249 | 6.59 | 0 | 16.30 | 515.39 | 32380 |
| Node | 1300 | 149 | 141 | 760 | 18.10 | 0 | 16.30 | 715.18 | 44918 |
| TOTAL | 3900 | 262 | 140 | 789 | 161.18 | 0 | 48.28 | 2086.34 | 44246.67 |
48 concurrent visitors, 60 loops
Load: 0.79
| Samples | Avg. response time (ms) | Min. response time (ms) | Max. response time (ms) | Std dev | Error % | Throughput (pages/sec) | Throughput (kb/sec) | Avg. transferred bytes | |
|---|---|---|---|---|---|---|---|---|---|
| Homepage | 2880 | 749 | 420 | 4564 | 425.14 | 0 | 32.70 | 1770.37 | 55442 |
| Landing Page | 2880 | 269 | 145 | 9375 | 380.96 | 0 | 32.84 | 1038.30 | 32380 |
| Node | 2880 | 281 | 146 | 9442 | 437.14 | 0 | 32.83 | 1439.89 | 44918 |
| TOTAL | 8640 | 433 | 145 | 9442 | 471.34 | 0 | 97.59 | 4216.63 | 44246.67 |
100 concurrent visitors, 30 loops
Load: 0.9
| Samples | Avg. response time (ms) | Min. response time (ms) | Max. response time (ms) | Std dev | Error % | Throughput (pages/sec) | Throughput (kb/sec) | Avg. transferred bytes | |
|---|---|---|---|---|---|---|---|---|---|
| Homepage | 3000 | 1411 | 250 | 16298 | 1373.02 | 0 | 33.71 | 1825.40 | 55442 |
| Landing Page | 3000 | 581 | 144 | 10285 | 1110.44 | 0 | 33.86 | 1070.72 | 32380 |
| Node | 3000 | 554 | 144 | 10044 | 1023.61 | 0 | 34.15 | 1498.20 | 44918 |
| TOTAL | 9000 | 849 | 144 | 16298 | 1243.76 | 0 | 100.80 | 4355.42 | 44246.67 |
Finally, I ran one test with authenticated users so that I can compare the performance of serving anonymous users to that of serving authenticated users.
13 concurrent visitors, 30 loops, authenticated user
Load 14.51
| Samples | Avg. response time (ms) | Min. response time (ms) | Max. response time (ms) | Std dev | Error % | Throughput (pages/sec) | Throughput (kb/sec) | Avg. transferred bytes | |
|---|---|---|---|---|---|---|---|---|---|
| Homepage | 390 | 2216 | 1010 | 4017 | 487.53 | 0 | 2.11 | 135.61 | 65873 |
| Landing Page | 390 | 1874 | 896 | 3471 | 422.00 | 0 | 2.12 | 89.07 | 43025 |
| Node | 390 | 1900 | 903 | 3642 | 478.98 | 0 | 2.13 | 116.30 | 55933 |
| TOTAL | 1183 | 2003 | 896 | 4017 | 493.82 | 0 | 6.27 | 334.87 | 54675.93 |
(The line of the login page is not shown)
Conclusion and Insights
The first thing that catches the eye is that the throughput is 1/7th as high for authenticated users as it is for anonymous. This stems from the fact that Drupal page caching is enabled on the site, and anonymous users are served from cache, while pages are regenerated for every pageload for authenticated users. This test also increased the server load to 14.51, which indicates a bit of an overload. Considering that the server is powered by an Intel Xeon L5420 processor with 4 cores, the server load should not stay over 4 for a longer period, as this means the full utilization of the 4 cores. For anonymous users, it does not get close to being overloaded for up to 100 concurrent visitors.
Next thing I noticed is that the front page loads considerably slower than the other pages. This is an unexpected outcome, because if page cache is enabled, then all the pages should be served from cache, in which case I do not see any reason why the front page could be that much slower. This may be something that requires further investigation on my part.
One piece of the test results that can be compared with the data available in Analytics is throughput. From the number of pageviews, one can calculate the throughput necessary to server the given number of requests. I used the data from the spike in the last figure as a basis of comparison. Applying the formula Number of Pageviews / Length of Time Interval = Throughput, we get
5,328 requests / (60 minutes * 60 seconds) = 1.45 requests / second
which is well below the capacity measured for up to 100 concurrent anonymous visitors. For authenticated users, it would be really close to the rate that the server can actually serve. This should be taken into consideration, should the site decide to open up registration and encourage users to log in.
It is important to note that the factor between concurrent users and the number of pageviews – or Average Pageviews, as Analytics calls it - will vary. A small number of concurrent visitors can initiate more requests on one site than a larger number of visitors on another site. For that reason, knowing that the server can deal with a given number of concurrent visitors may or may not be enough depending on how many pageviews those visitors generate.