Benchmark Report

Background

State of Museum Digital: 2026 Benchmark

How Does Your Museum Website Stack Up?


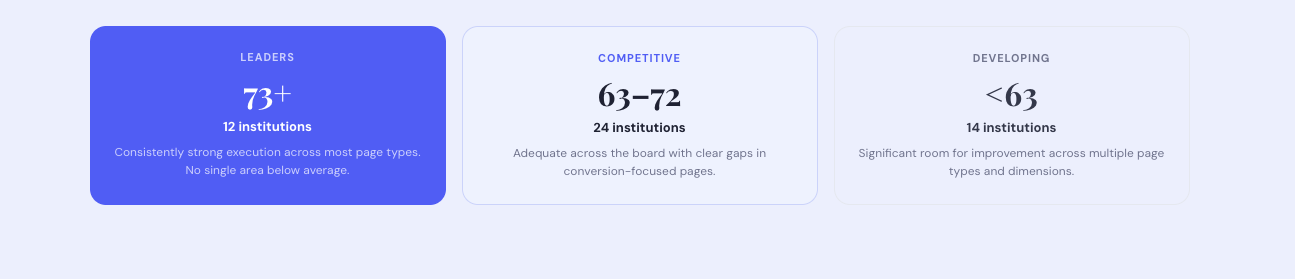
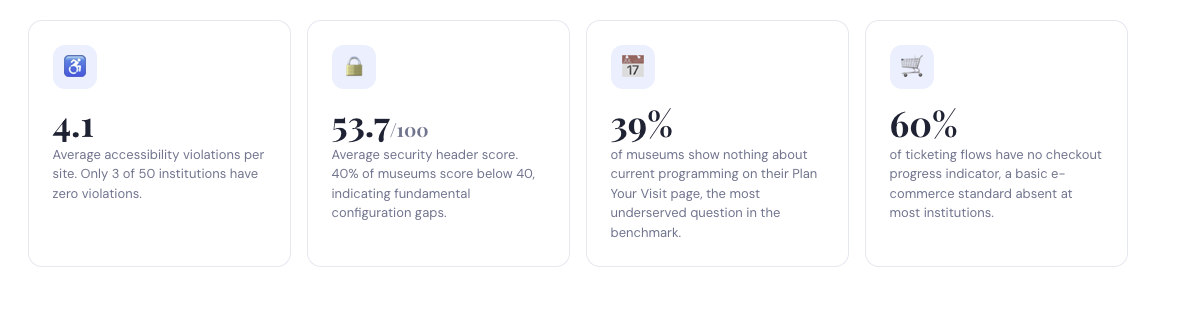
We partnered with Pantheon to evaluate 50 cultural institution websites across visitor experience, mobile performance, accessibility, and security. The results reveal a sector that excels at first impressions, but struggles everywhere it matters most.

Report

Museum websites are built to impress, not to convert

Most museums have invested heavily in looking good online. But the pages that actually drive revenue, ticketing, membership, and exhibitions, score the lowest in our benchmark. Mobile performance averages 40.6 out of 100. Four in ten institutions have failing security configurations. The problem is not a lack of investment. It is a lack of integration.

blank back

Three things the data keeps saying

Across 50 institutions and 54 evaluation criteria, the same patterns appear regardless of museum size, budget, or type.

Three key things
Background

Where museums invest vs. where visitors convert

Average UX scores across 50 institutions. The line marks the overall mean of 67.1.

Chart

The mobile emergency

The gap between desktop and mobile is not a technical constraint but it is a design and infrastructure choice.

Graphs
Background

Where does your institution sit?

50 institutions scored across UX quality. The middle tier consisting of 24 institutions  is the most strategic opportunity. Adequacy is a ceiling, not a floor.

Institution

The hidden liabilities

Technical health is not correlated with design quality. Some of the most visually impressive sites have the worst security and accessibility scores.

Libality

Strategy and craft, not just code

Urban Insight has 25 years of experience building websites for cultural institutions including LACMA, The Broad, the National WWI Museum, and the North Carolina Museum of Art. We cover the full digital lifecycle: UX strategy, content architecture, Drupal and WordPress development, ticketing integration, and accessibility remediation.
 

The patterns this benchmark identifies are the same ones we've been diagnosing and solving for institutions across the country for over two decades. We know what these problems cost. We know what fixing them looks like.